Period Performance Breakdown
Analyze historical returns by month, quarter, or week.
Quickly identify strong and weak periods, yearly performance patterns, and recurring market behavior.
Built for active traders
You bring the strategy. We hand you 30+ years of history, insider flow, congressional trades, earnings, and macro context — already on your chart. Stop guessing. Trade on evidence.
Years of history
Tracked symbols
Indicators
Unique features
The trader's reality
Most platforms hand you a chart and call it a day. So you patch the gaps yourself — jumping between filings, calendars, screeners, and spreadsheets while the setup you spotted moves on without you.
You see a setup, but you can't tell if it has worked before.
You react after the news cycle has already pushed the price.
You bury great setups under noisy watchlists and dead alerts.
You pay for five tools that still don't talk to each other.
What changes for you
TailoredMarketData puts the research, the history, and the live context on one screen — so you stop reacting and start anticipating.
Move from a symbol idea to the full story with technicals, historical behavior, earnings, insider flow, and political trading in one place.
Validate setups against real historical occurrences, performance tables, win rates, gaps, events, and chart behavior before you act.
Use filters, saved groups, indicators, and alerts so your best setups come forward instead of getting buried in watchlists.
Before vs after
Same hours in your day. Same brain. A completely different research surface wrapped around the way you actually trade.
Try it on your watchlistYou jump between charts, filings, calendars, screeners, and spreadsheets.
You research a symbol from one focused workflow and keep the thesis intact.
You see a setup, but you do not know how similar setups behaved before.
You test the exact conditions against decades of market history.
You react to price movement after the story is already noisy.
You combine price action with insider, political, earnings, and event context.
Real questions. Answered in seconds.
The questions you actually ask before a trade — and how TailoredMarketData answers them before your coffee gets cold.
Pattern Occurrences scans every match across 30 years of AAPL history and returns the win rate, average move, and worst drawdown.
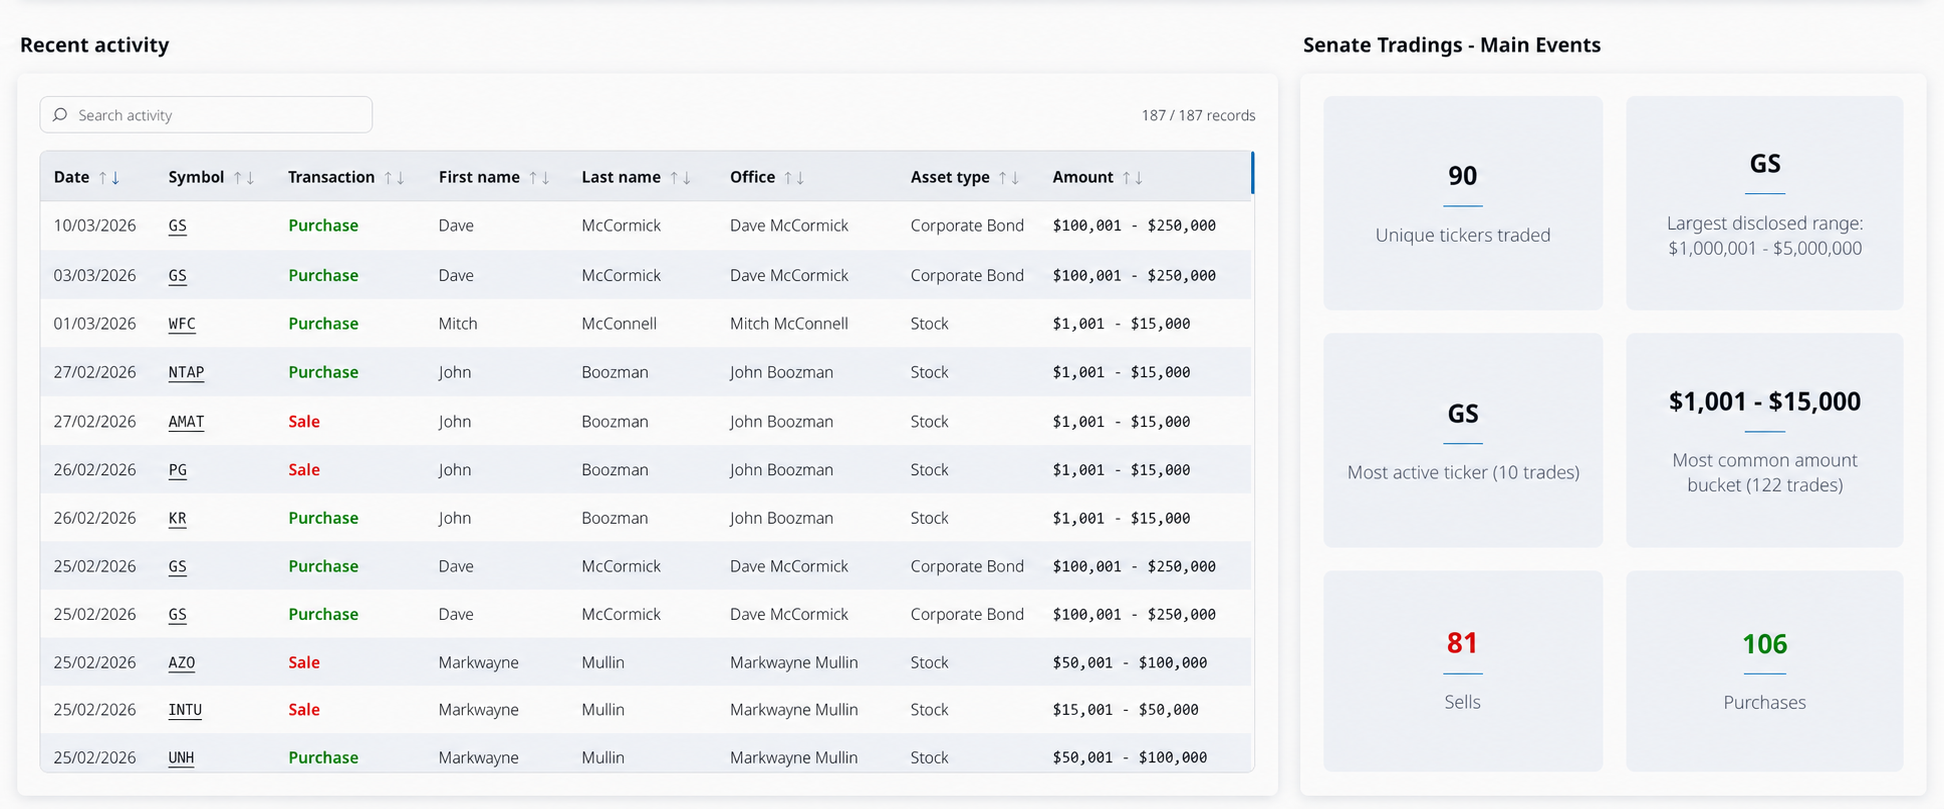
Senate Trading filters every disclosure by sector and date, ranks by transaction size, and surfaces unusual conviction moves.
Earnings reaction stats show the average move, win rate, and post-report behavior across every NVDA earnings event on record.
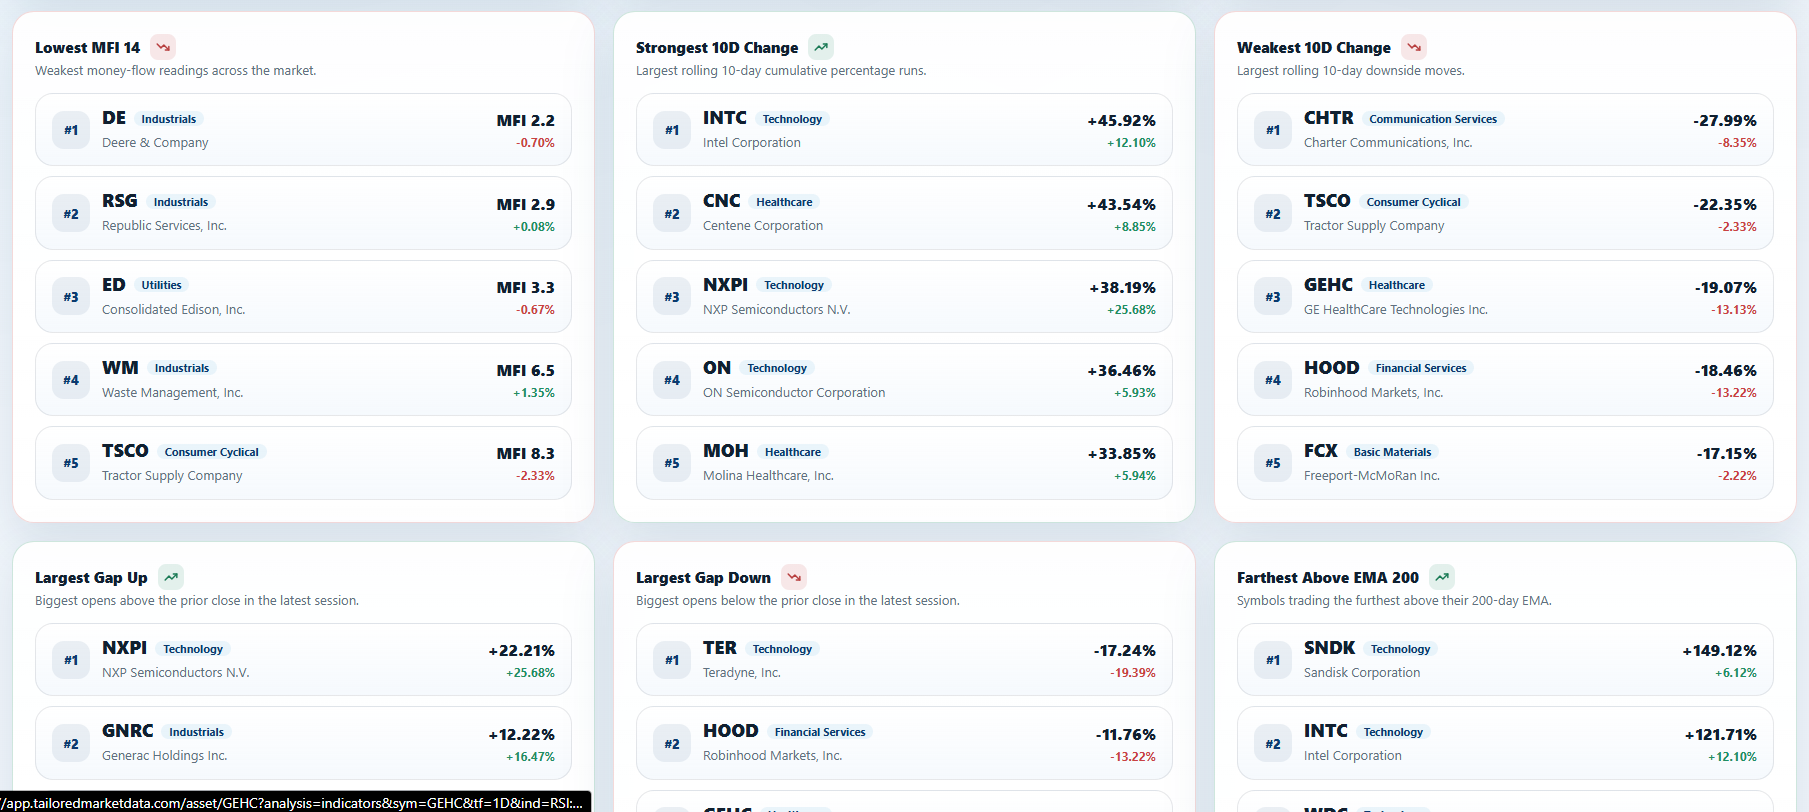
The daily dashboard already has it — names breaking out, breaking down, and approaching extremes are ranked and waiting for you each morning.
Insider tracking surfaces every multi-officer buy window in a clean view, with the ability to drill straight from the filing to the chart.
Stats by Day breaks down the average move, win rate, and volatility for every day of the week — across the symbol or your whole watchlist.
The daily dashboard surfaces every name that crossed a key indicator threshold — RSI, MACD, EMA crosses, Bollinger breaches — across stocks and crypto.
Splits tracking shows historical price behavior before and after every split, so you can size positions and time entries around the announcement and effective dates.
Index Listing tracks every addition and removal, with the post-event price behavior so you can see how index inclusion really plays out.
Pattern Occurrences tests every prior breach of round-number market caps — $500B, $1T, $2T — and shows how price typically reacted in the days and weeks after.
Quantify every streak — 3, 5, 7 green or red days in a row — and see the average bounce, follow-through, and win rate across decades of history.
And many, many more questions like these — answered in seconds, every day.
Daily market dashboard
Open the dashboard each morning and see exactly what the market is screaming about — across thousands of stocks, ETFs, indices, and crypto. The outliers come to you, ranked and filterable, so you spend your hours on opportunities instead of hunting for them.
What's waiting for you each morning
Need a scan we don't have yet? Ask for it.
If your edge lives on a metric we haven't built, request it. We'll wire it into your dashboard so it's there every morning — tailored to how you trade.
Request a custom scan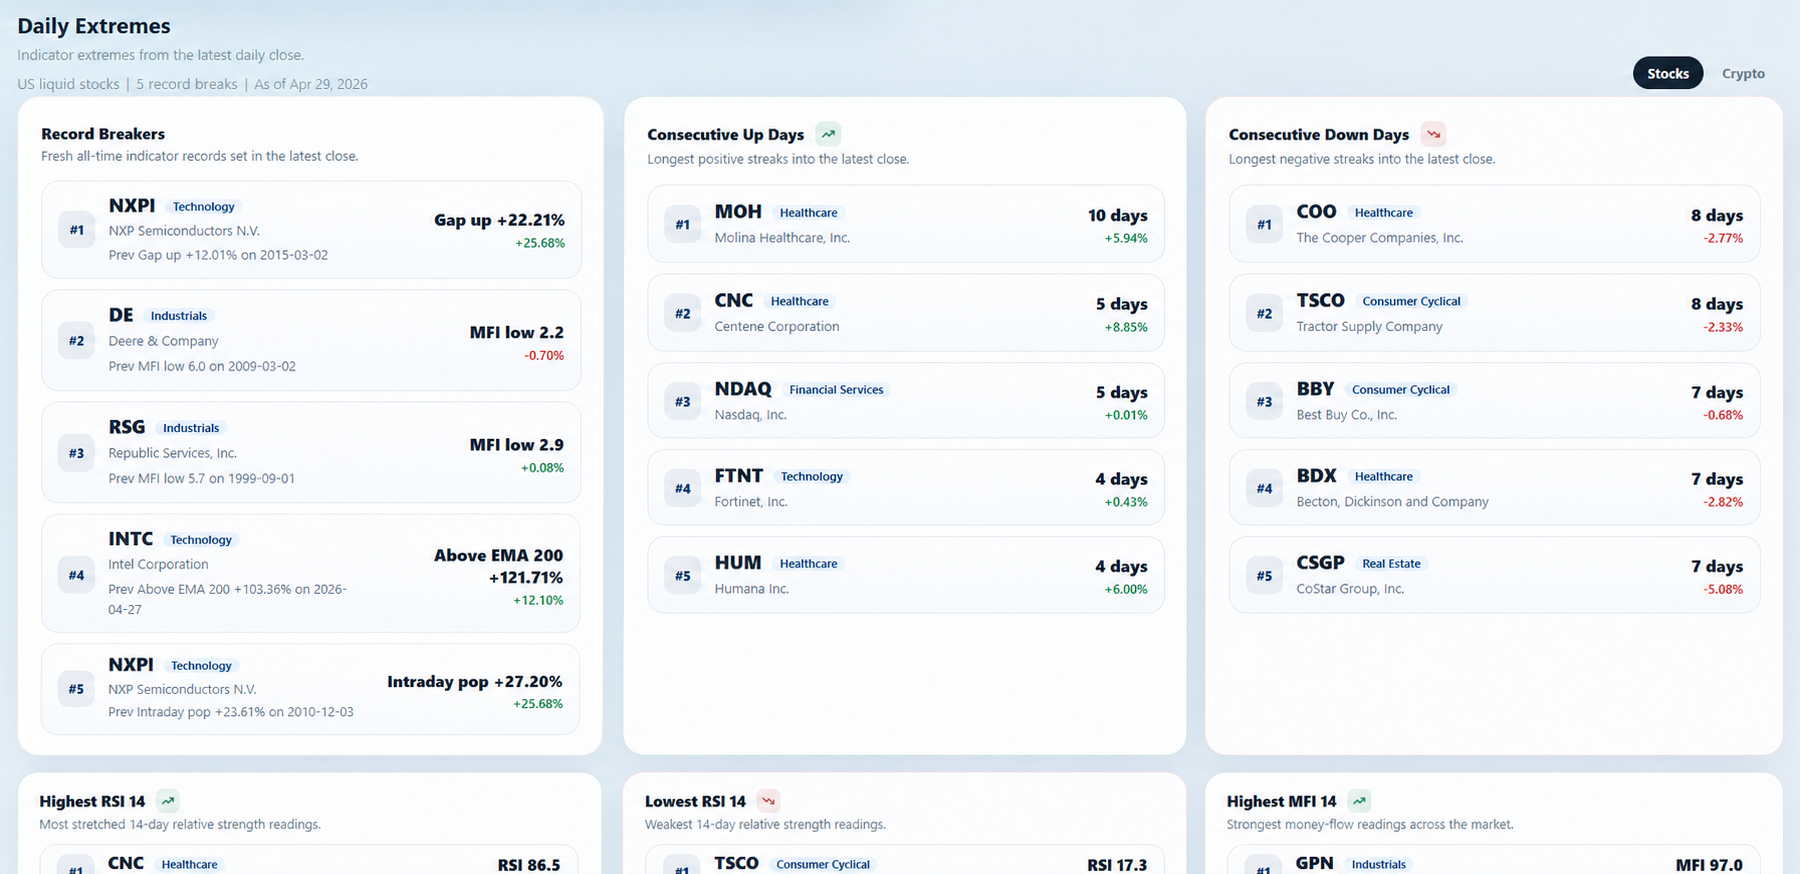
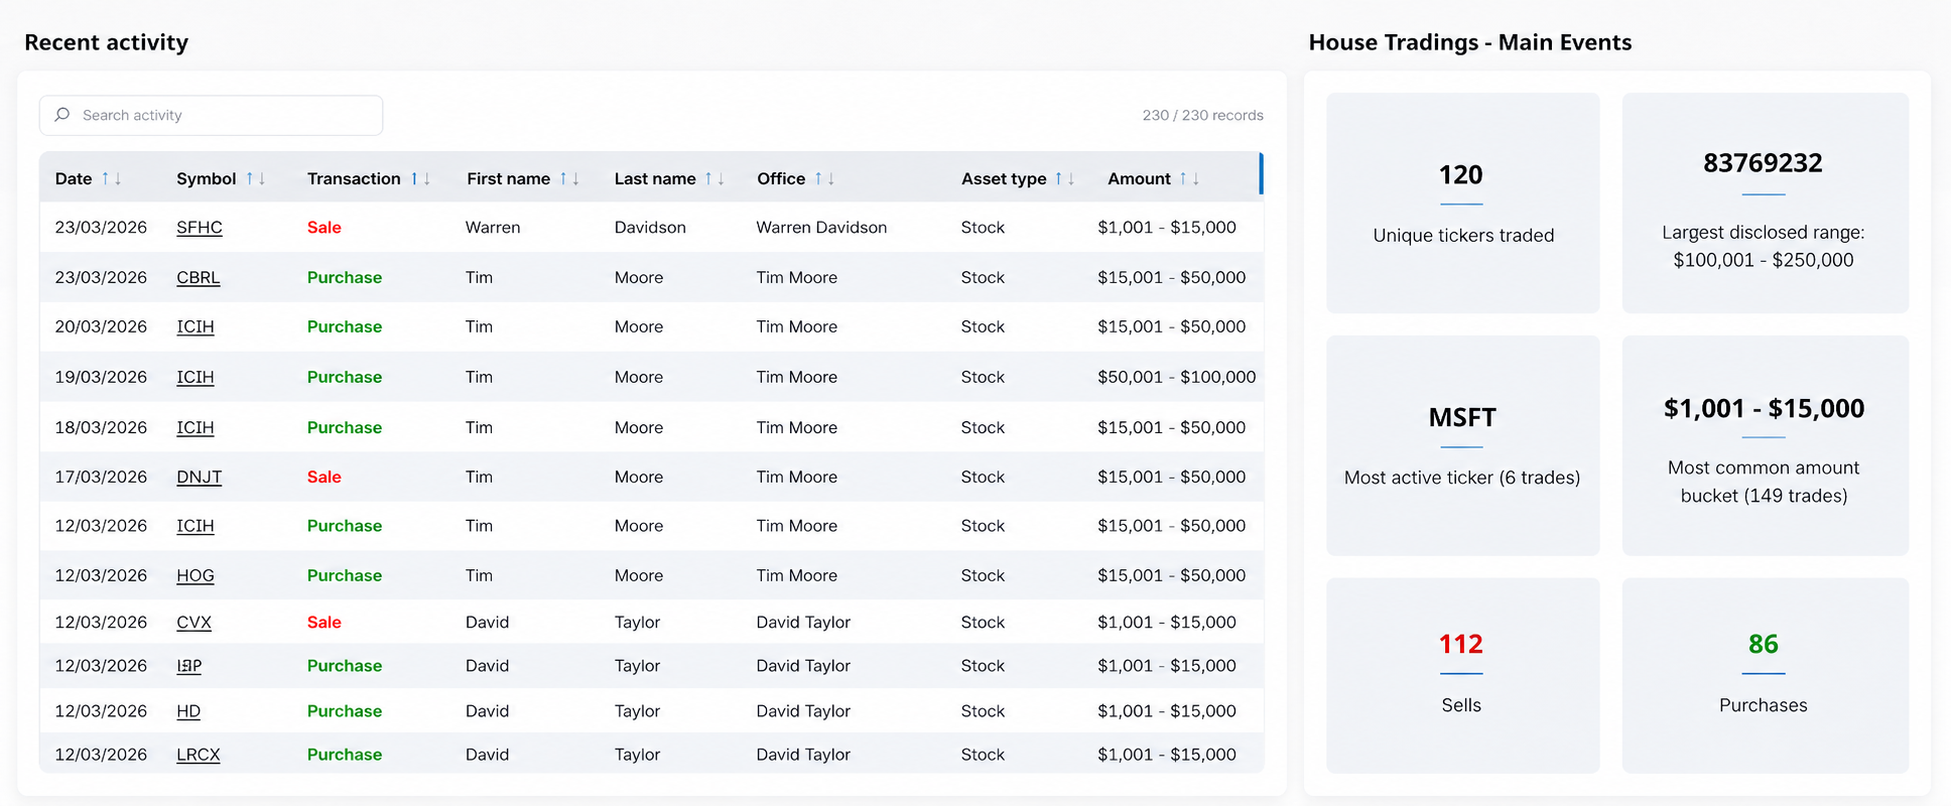
Follow the smart money
Disclosures are public, but they're a mess. You get a clean research surface that helps you spot conviction, compare activity, and follow a single name's history all the way through.
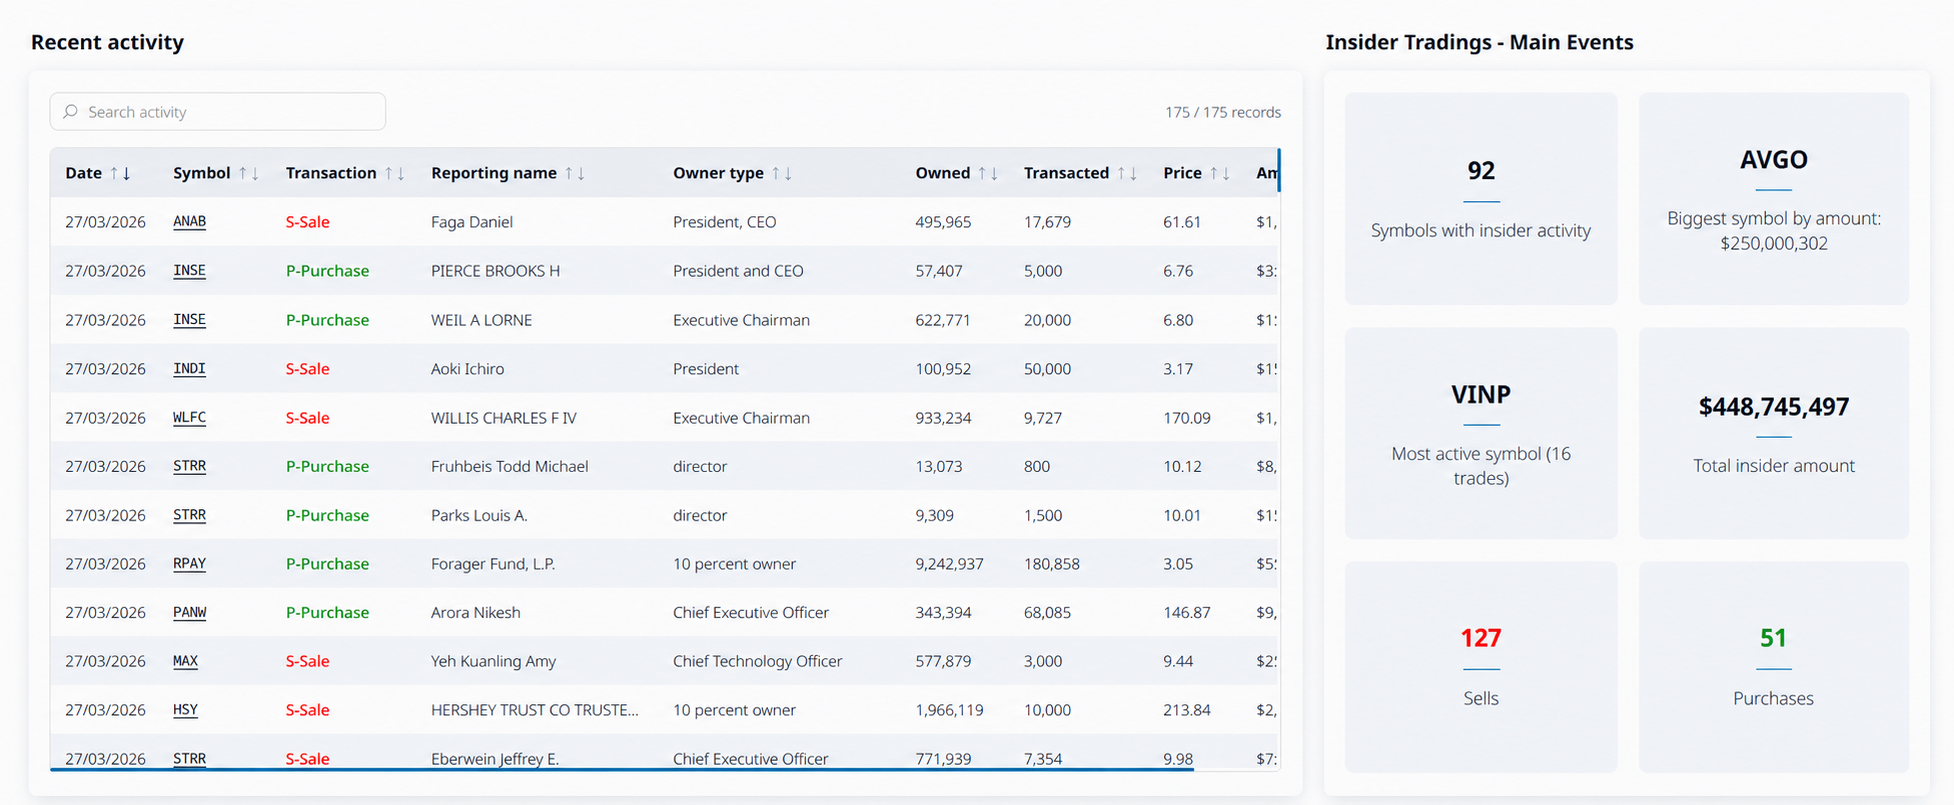
Turn dense insider filings into a readable signal layer that helps you judge timing, transaction size, and repeated buying or selling pressure.
Senate trading activity becomes easier to evaluate when it is organized around comparison, filtering, and unusual conviction instead of a plain disclosure feed.
House trading data is structured to help you track representatives, compare activity, and understand where capital is moving without losing time in noisy disclosures.
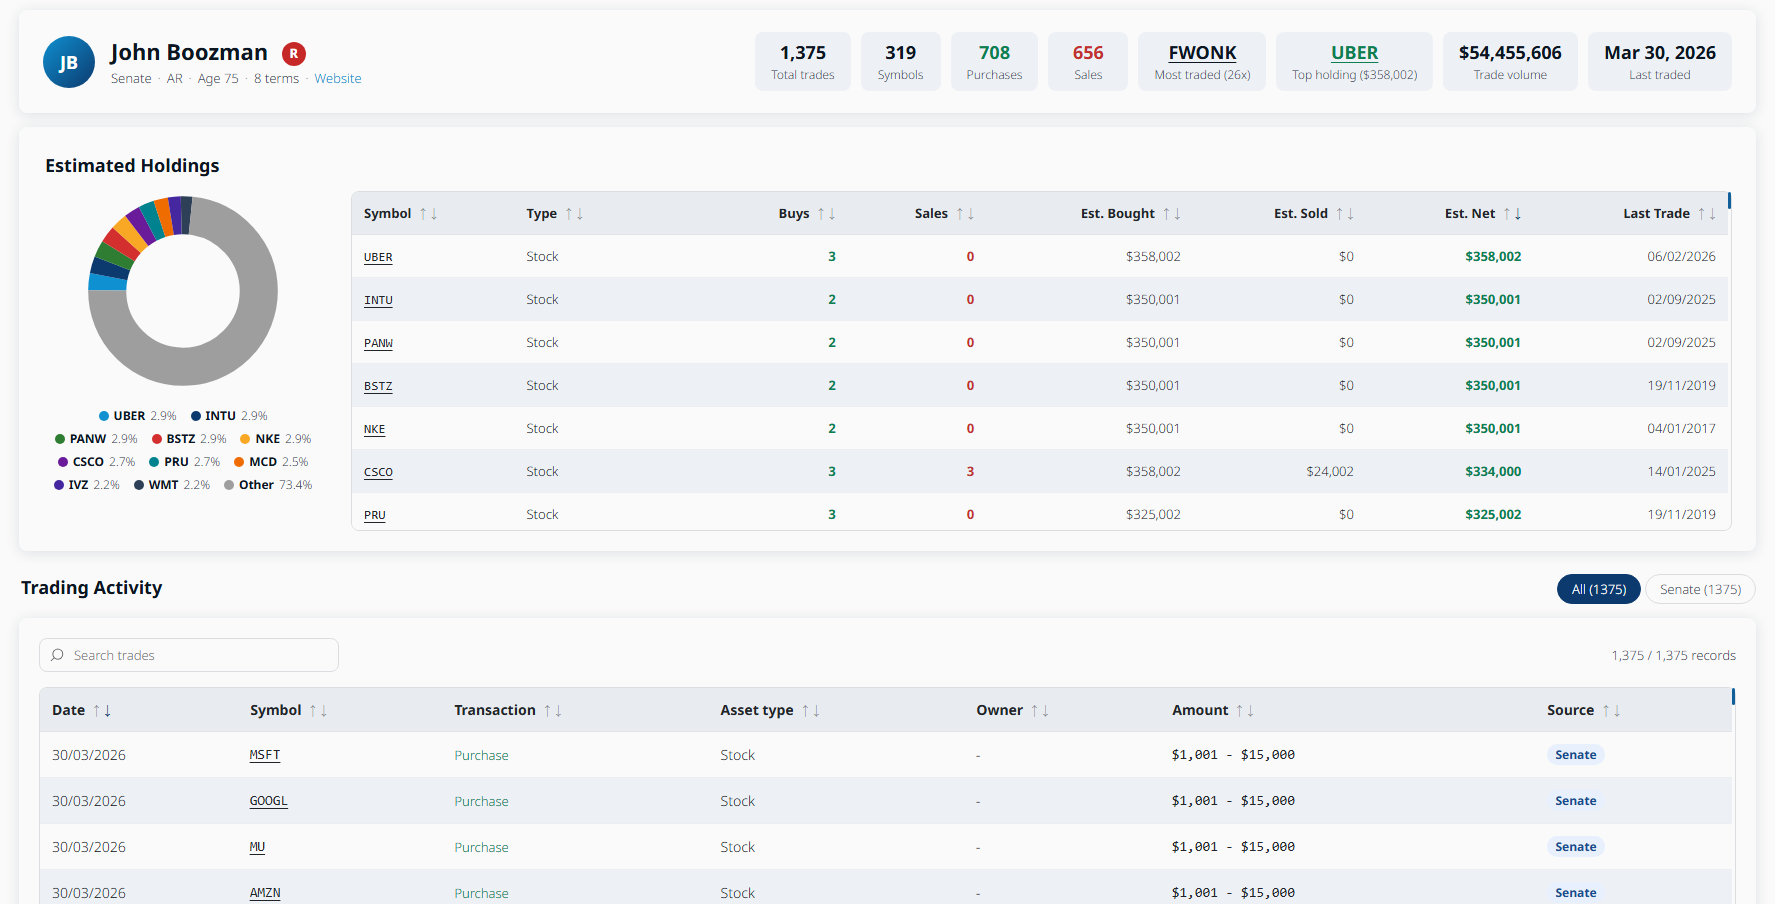
From any trading page, move into a dedicated profile view that combines the full transaction history with a live snapshot of that person's current portfolio holdings.
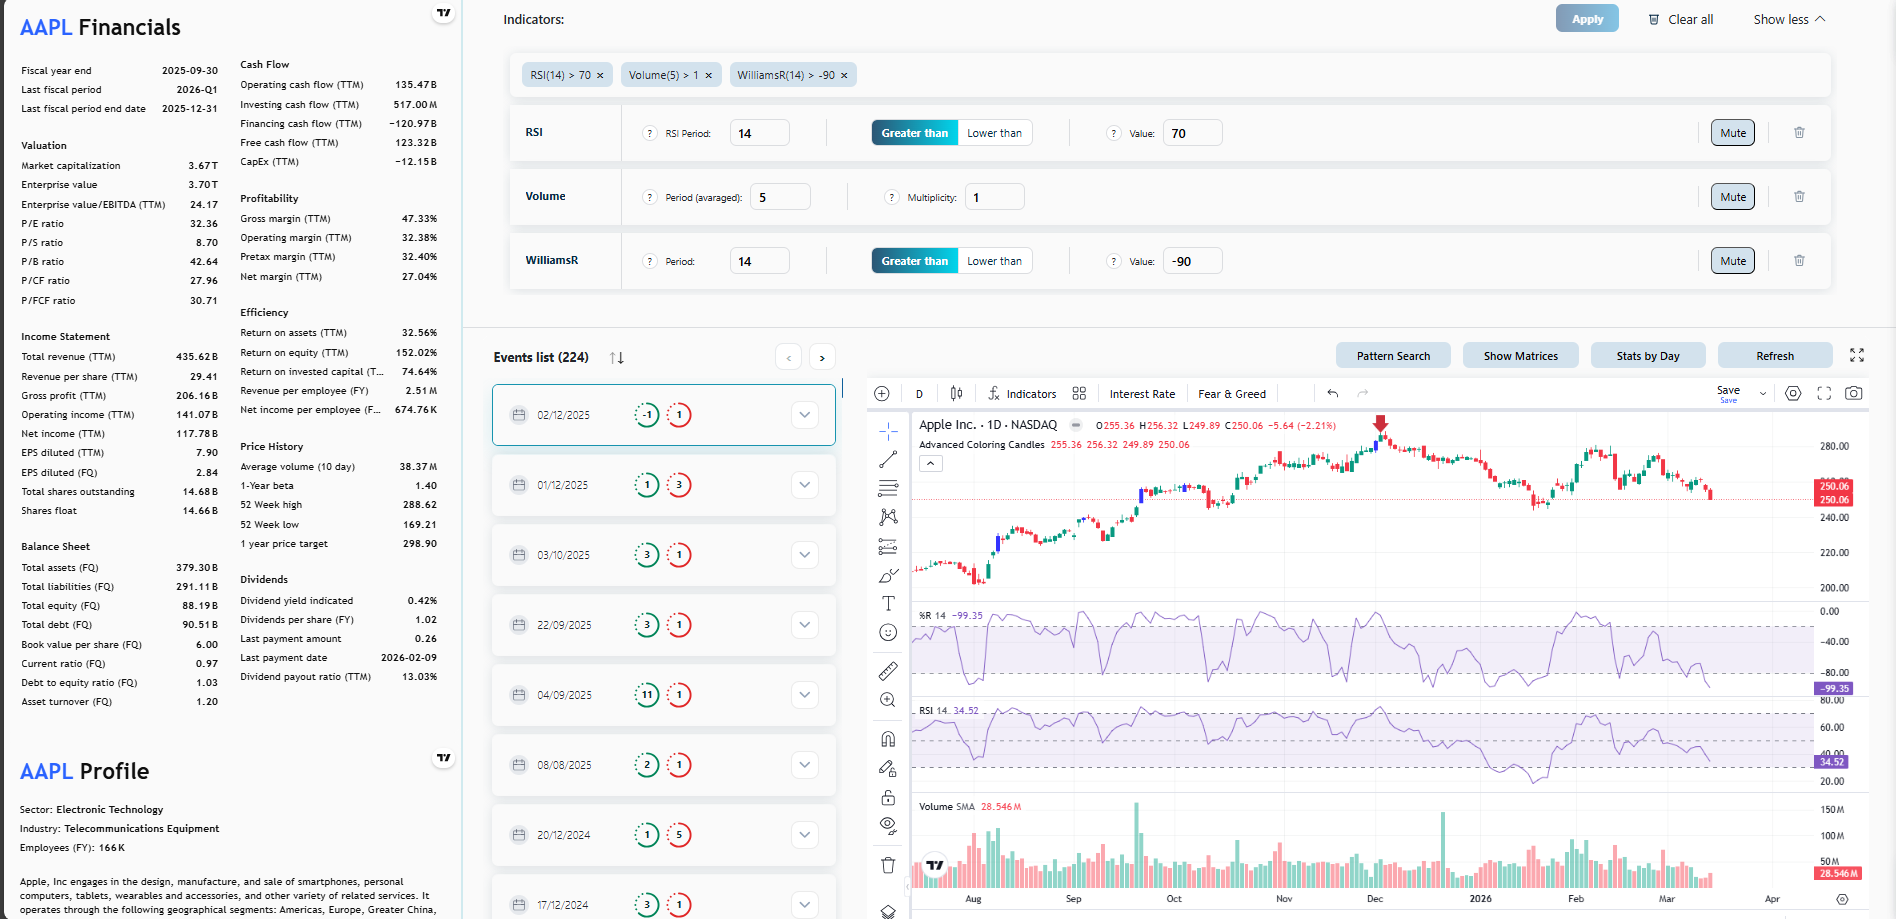
Find patterns that match your strategy.
Use built-in or custom technical indicators to scan historical data for exact setups.
Choose from popular indicators like EMA, RSI, MACD, and more.
Set your own conditions
Instantly view historical occurrences for any symbol or group of symbols.
Create and save custom indicators tailored to your trading logic.
Perfect for backtesting, spotting trends, and building data-backed strategies.
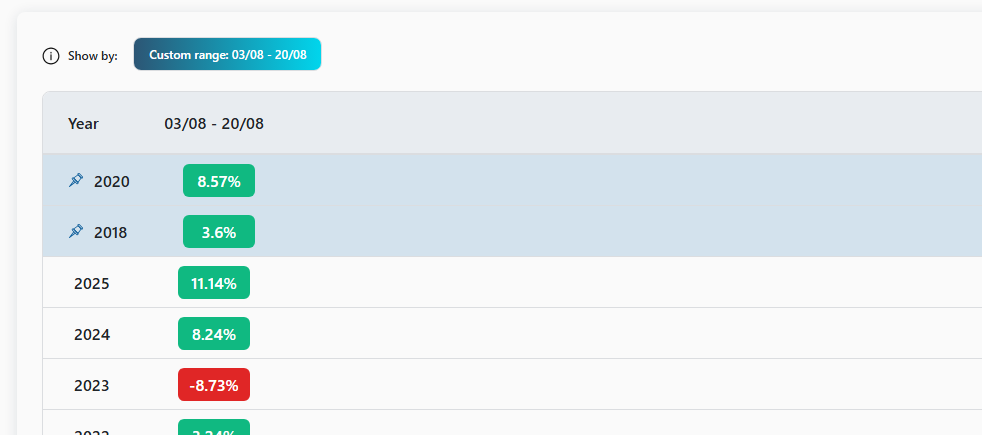
Analyze historical returns by month, quarter, or week.
Quickly identify strong and weak periods, yearly performance patterns, and recurring market behavior.
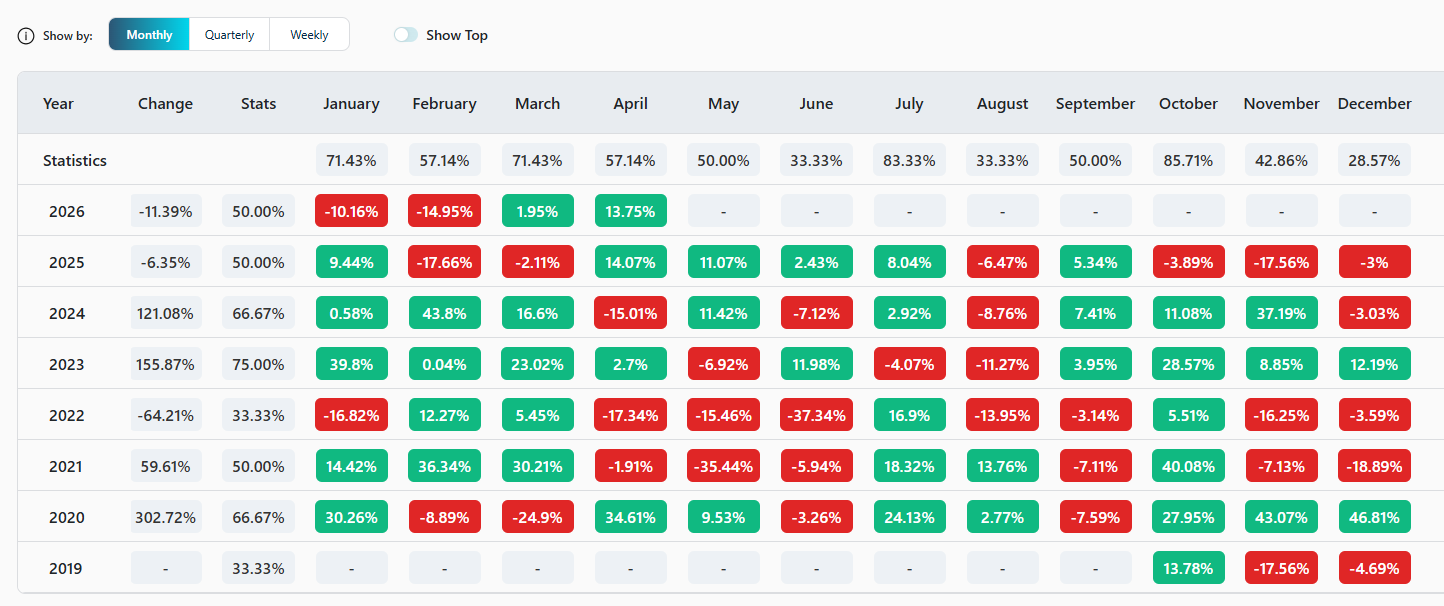
View summary metrics like average return, win rate, and drawdown.
Analyze single symbols or combined groups for deeper insight.
Choose any date range and compare historical returns year by year.
Discover recurring opportunities within the exact period you care about.
Enhance your charts with powerful, investor-friendly studies. With just one click:
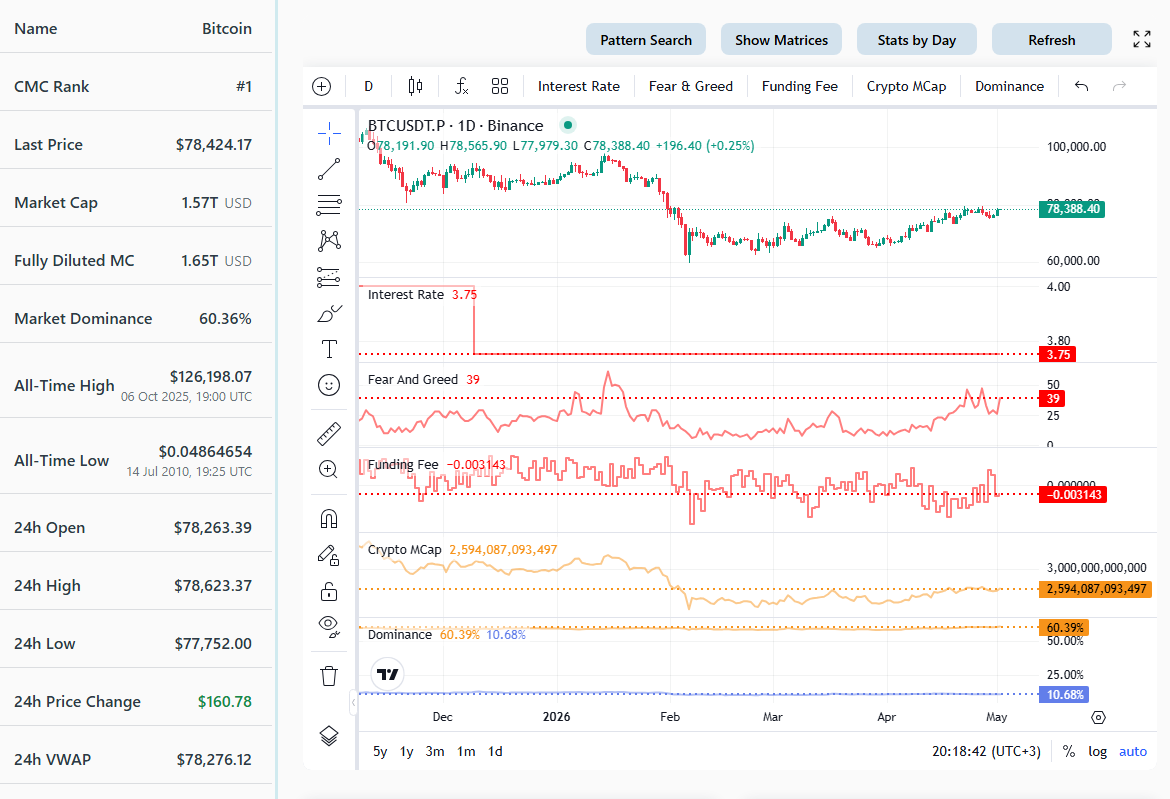
Quickly gauge valuation and earnings potential
Track market sentiment in real-time
Understand macro trends and monetary impact
See the size and strength of any asset
You're one workspace away
Open TailoredMarketData and validate your first setup against 30+ years of market history, insider flow, and live context — in the time it used to take you to open all your tabs.
No credit card required • Cancel anytime • Built by traders, for traders
The full toolbox
Click any feature to see exactly how it helps you scan, validate, and act faster.
Click any feature to see exactly how it supports your edge, execution, and strategy workflow.
Instant performance breakdowns for symbols and groups
Custom symbol groups with one-click group-level analysis
Backtest any indicator setup across 30+ years
Split-aware analysis for cleaner charts and position sizing
Dividend history, yields, and ex-date behavior in one place
Filter and study gap events with precision
Full index constituents and composition change tracking
Earnings calendar plus post-report reaction intelligence
Built-in and custom indicators on every chart
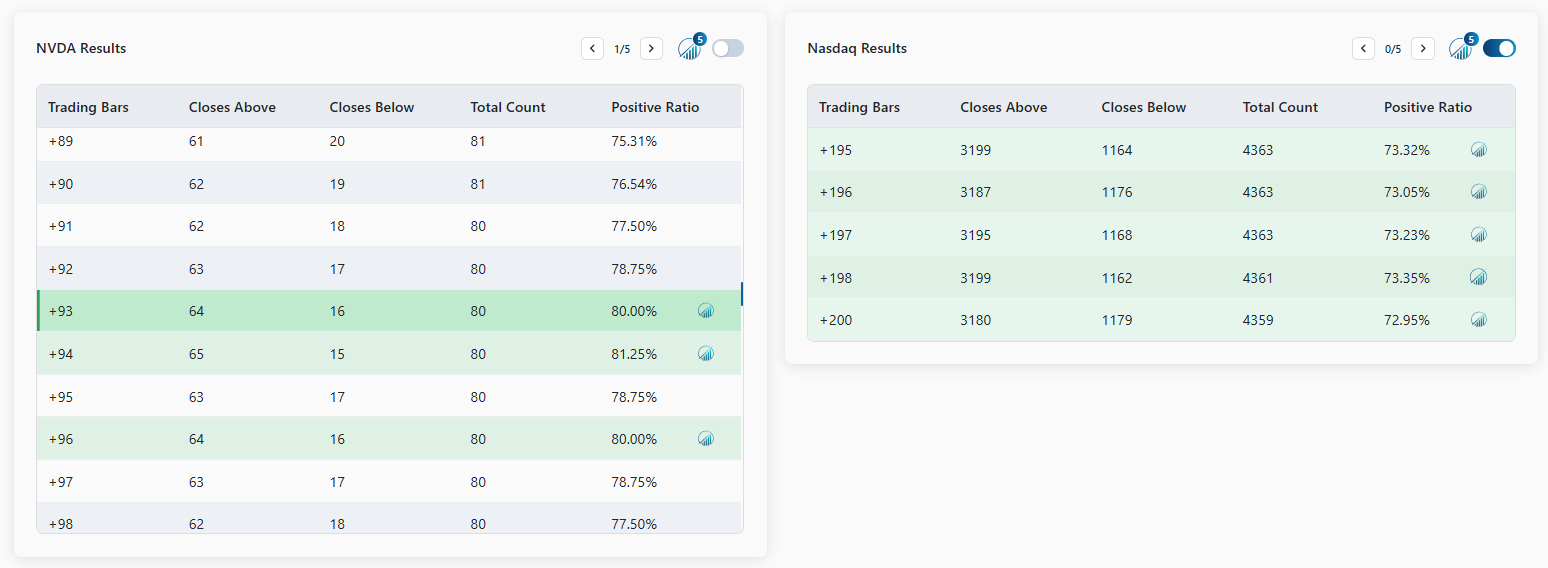
Forward-bar outcome ratios after each detected setup
Weekday green/red counts with chart date marking
See when company insiders buy or sell their own stock
Track political positioning without reading every disclosure
Where congressional capital is moving across symbols and sectors